
This article was co-authored with generative AI. Facts have been checked against public documentation where feasible, but errors may remain. Please verify primary sources before relying on this for important decisions.
I learned about OpenDrift, a drift-calculation library, and ran some experiments to get a better feel for it. As a concrete use case, I set the starting point offshore from Naze Port in Amami and ran a 10-day drift simulation using monthly climatology data.
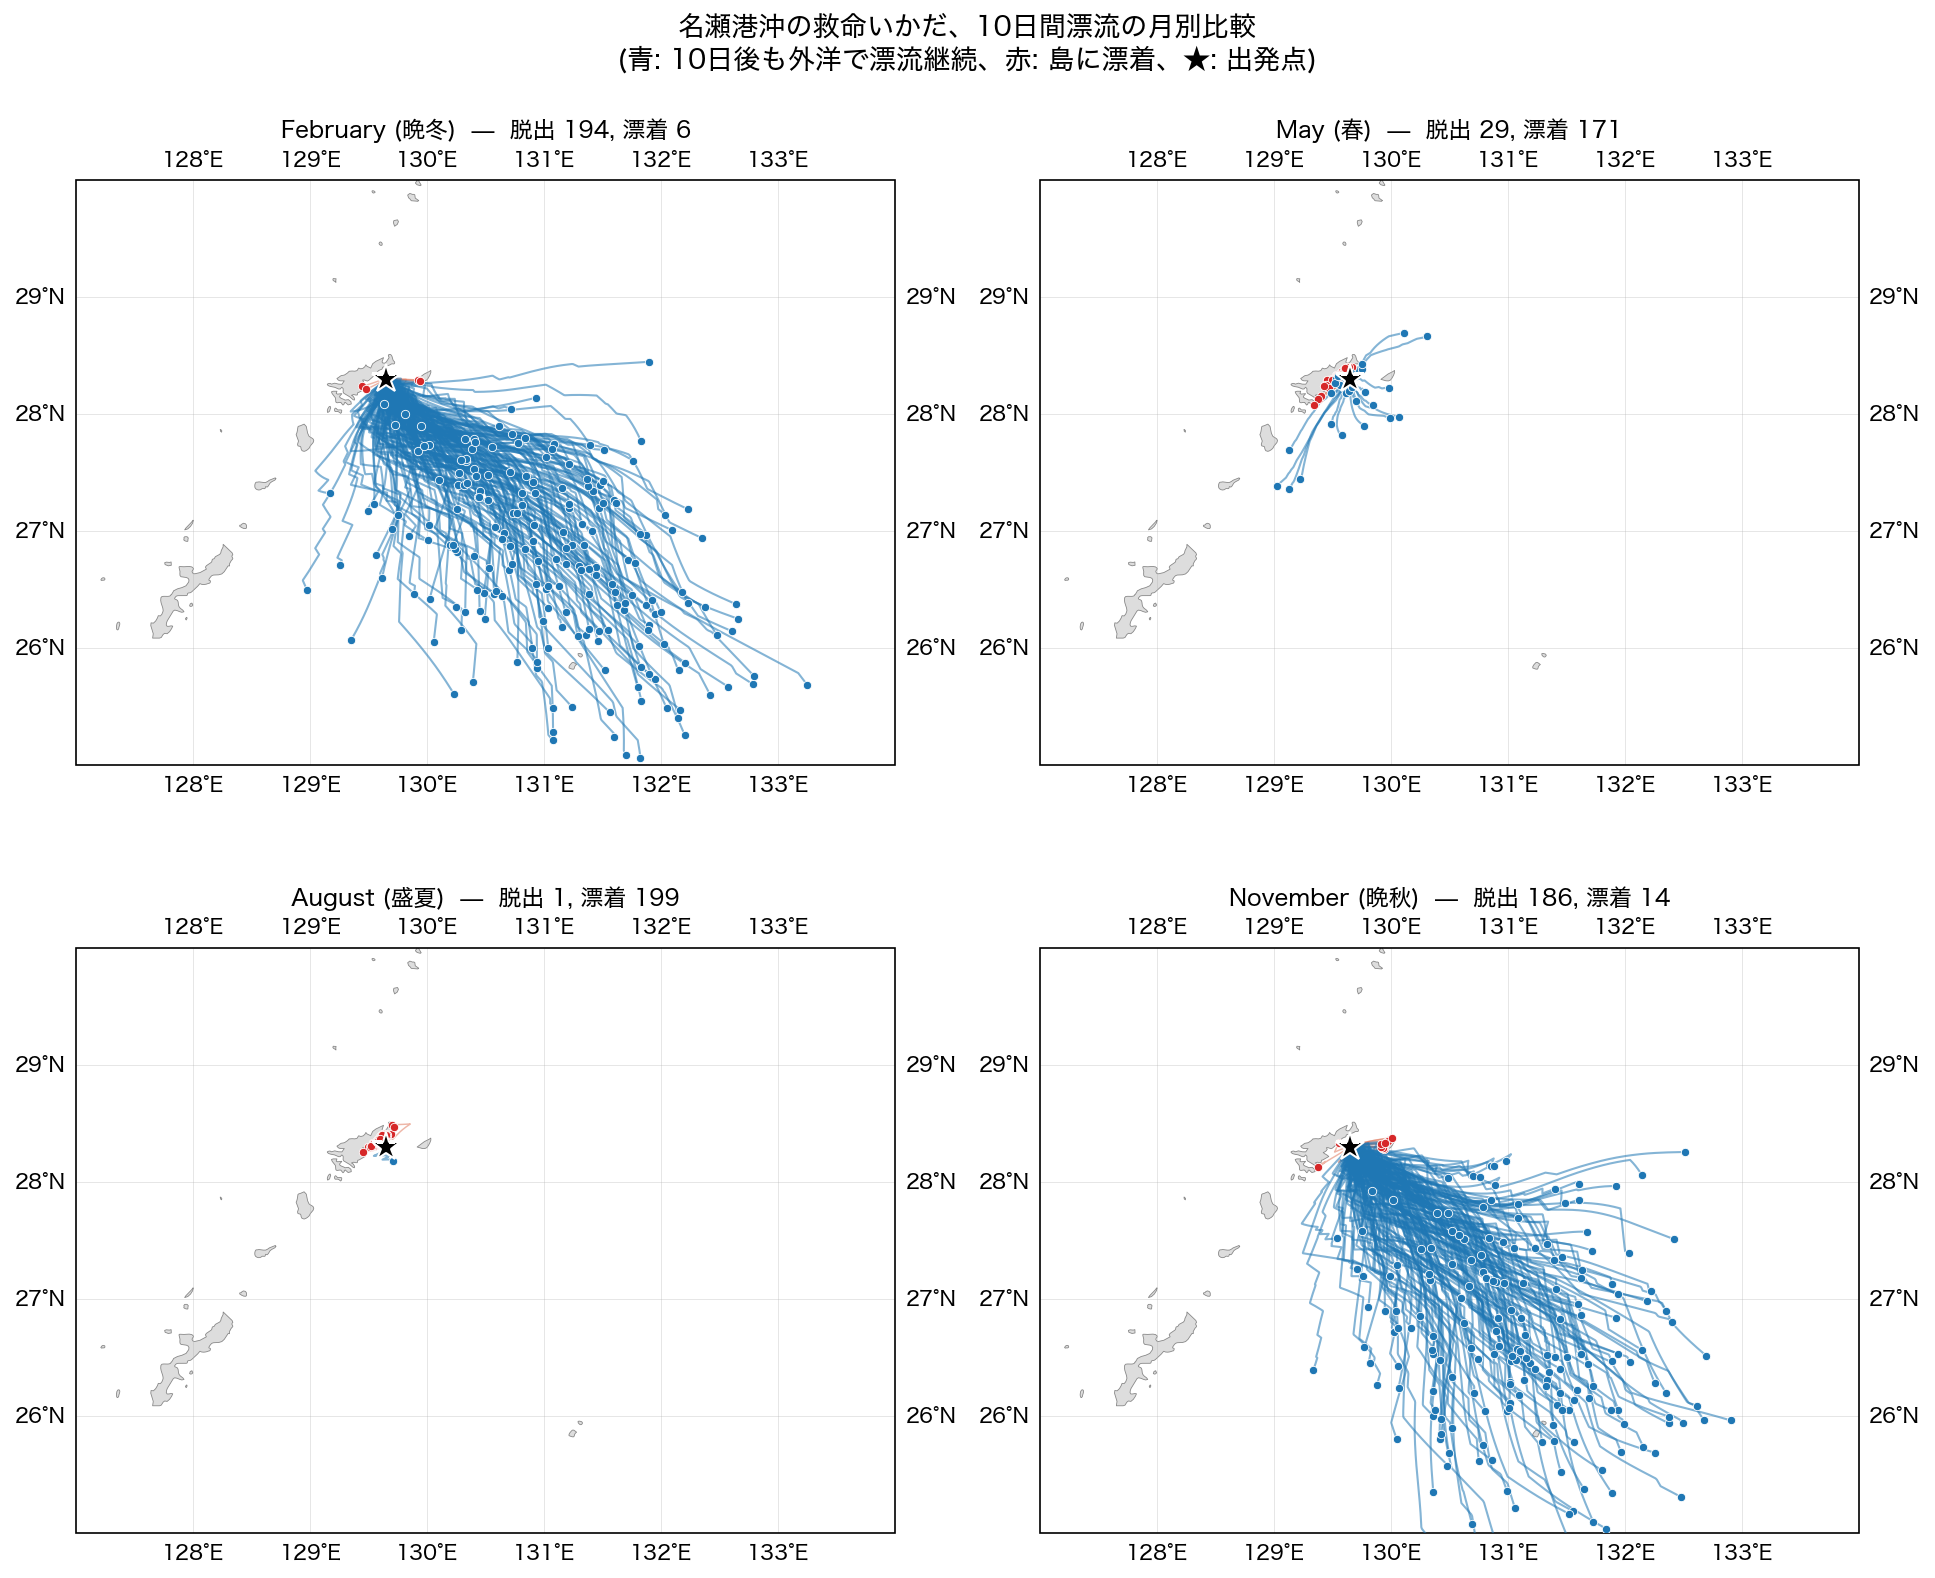
The star marks the starting point. Blue particles are still drifting in the open ocean after 10 days; red particles have stranded on Amami Oshima.
Software and Data Used
OpenDrift
A Python drift-calculation library published by the Norwegian Meteorological Institute. It is used for applications such as oil spill response, search and rescue, and plastic debris tracking.
OpenDrift includes a Leeway model that simulates how floating objects are carried by both currents and wind, using object-type-specific coefficients calibrated from physical experiments. The coefficients are based on at-sea experiments conducted by the US Coast Guard (USCG), including data from Allen & Plourde (1999) and similar studies.
For this simulation, object_type=26 (LIFE-RAFT-NB-1: a small, unballasted life raft) was selected.
Current Data: OSCAR
OSCAR (Ocean Surface Current Analysis Real-time) is a dataset published by Earth & Space Research (ESR) with NASA support. Ocean surface currents are estimated from satellite-measured sea surface height, sea surface temperature, and wind fields. Coverage begins in 1993.
Wind Data: NCEP/NCAR Reanalysis 1
A long-term US atmospheric reanalysis dataset providing 10-meter surface winds from 1948 onward. Available for download without registration from NOAA PSL (Physical Sciences Laboratory).
Climatology
Rather than data from a specific year, climatology represents a "typical state" averaged across many years. Using a "typical May Kuroshio" profile allows simulations that are not tied to any particular year.
Implementation
build_oscar_climatology.py     # Build monthly ocean current climatology from OSCAR 2015–2020 (one-time setup)
build_wind_climatology.py      # Build monthly wind climatology from NCEP/NCAR 1991–2020 (one-time setup)
leeway_climatology.py          # Run drift calculation for a selected month (offline, ~30 seconds per run)
The one-time setup downloads climatology data via OPeNDAP and saves it as CF-compliant NetCDF files. The combined file size is under 1 MB.
The simulation itself is about 150 lines of code. Month, starting coordinates, drift duration, particle count, and object type can all be changed as parameters.
o = Leeway(loglevel=20)
o.add_reader(reader_netCDF_CF_generic.Reader(currents_nc, name="OSCAR"))
o.add_reader(reader_netCDF_CF_generic.Reader(wind_nc, name="NCEP"))
o.seed_elements(
    lon=129.65, lat=28.30, time=start,
    number=200, object_type=26,
)
o.run(duration=timedelta(hours=240),
      time_step=timedelta(minutes=30),
      time_step_output=timedelta(hours=1))
Results
Starting from offshore Naze Port (longitude 129.65°, latitude 28.30°) with 200 particles, the stranding and escape ratios after 10 days were as follows:
| Month | Escaped to open ocean | Stranded on island |
|---|---|---|
| February (late winter) | 194 / 200 | 6 / 200 |
| May (spring) | 29 / 200 | 171 / 200 |
| August (midsummer) | 1 / 200 | 199 / 200 |
| November (late autumn) | 186 / 200 | 14 / 200 |
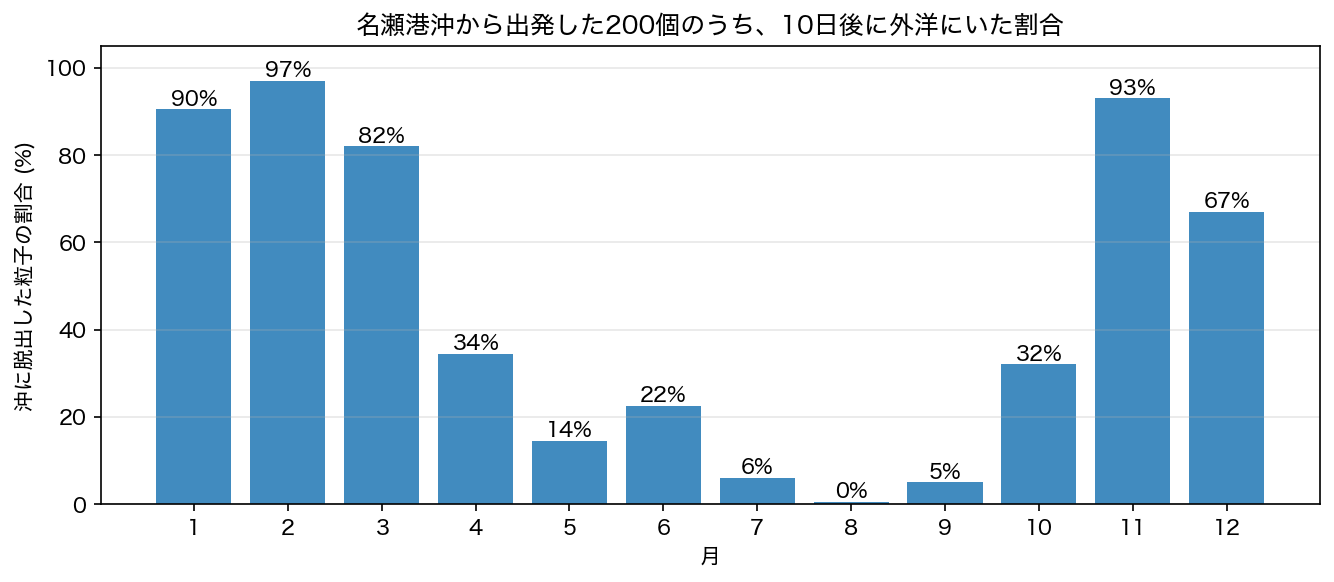
When computed across all months, a clear seasonal cycle emerged, with summer (July–September) and winter (November–March) showing nearly opposite patterns.
Causes of Seasonal Variation
Drift is determined by the combined effect of ocean currents and wind. Plotting both forces as vector fields by month makes the cause apparent.
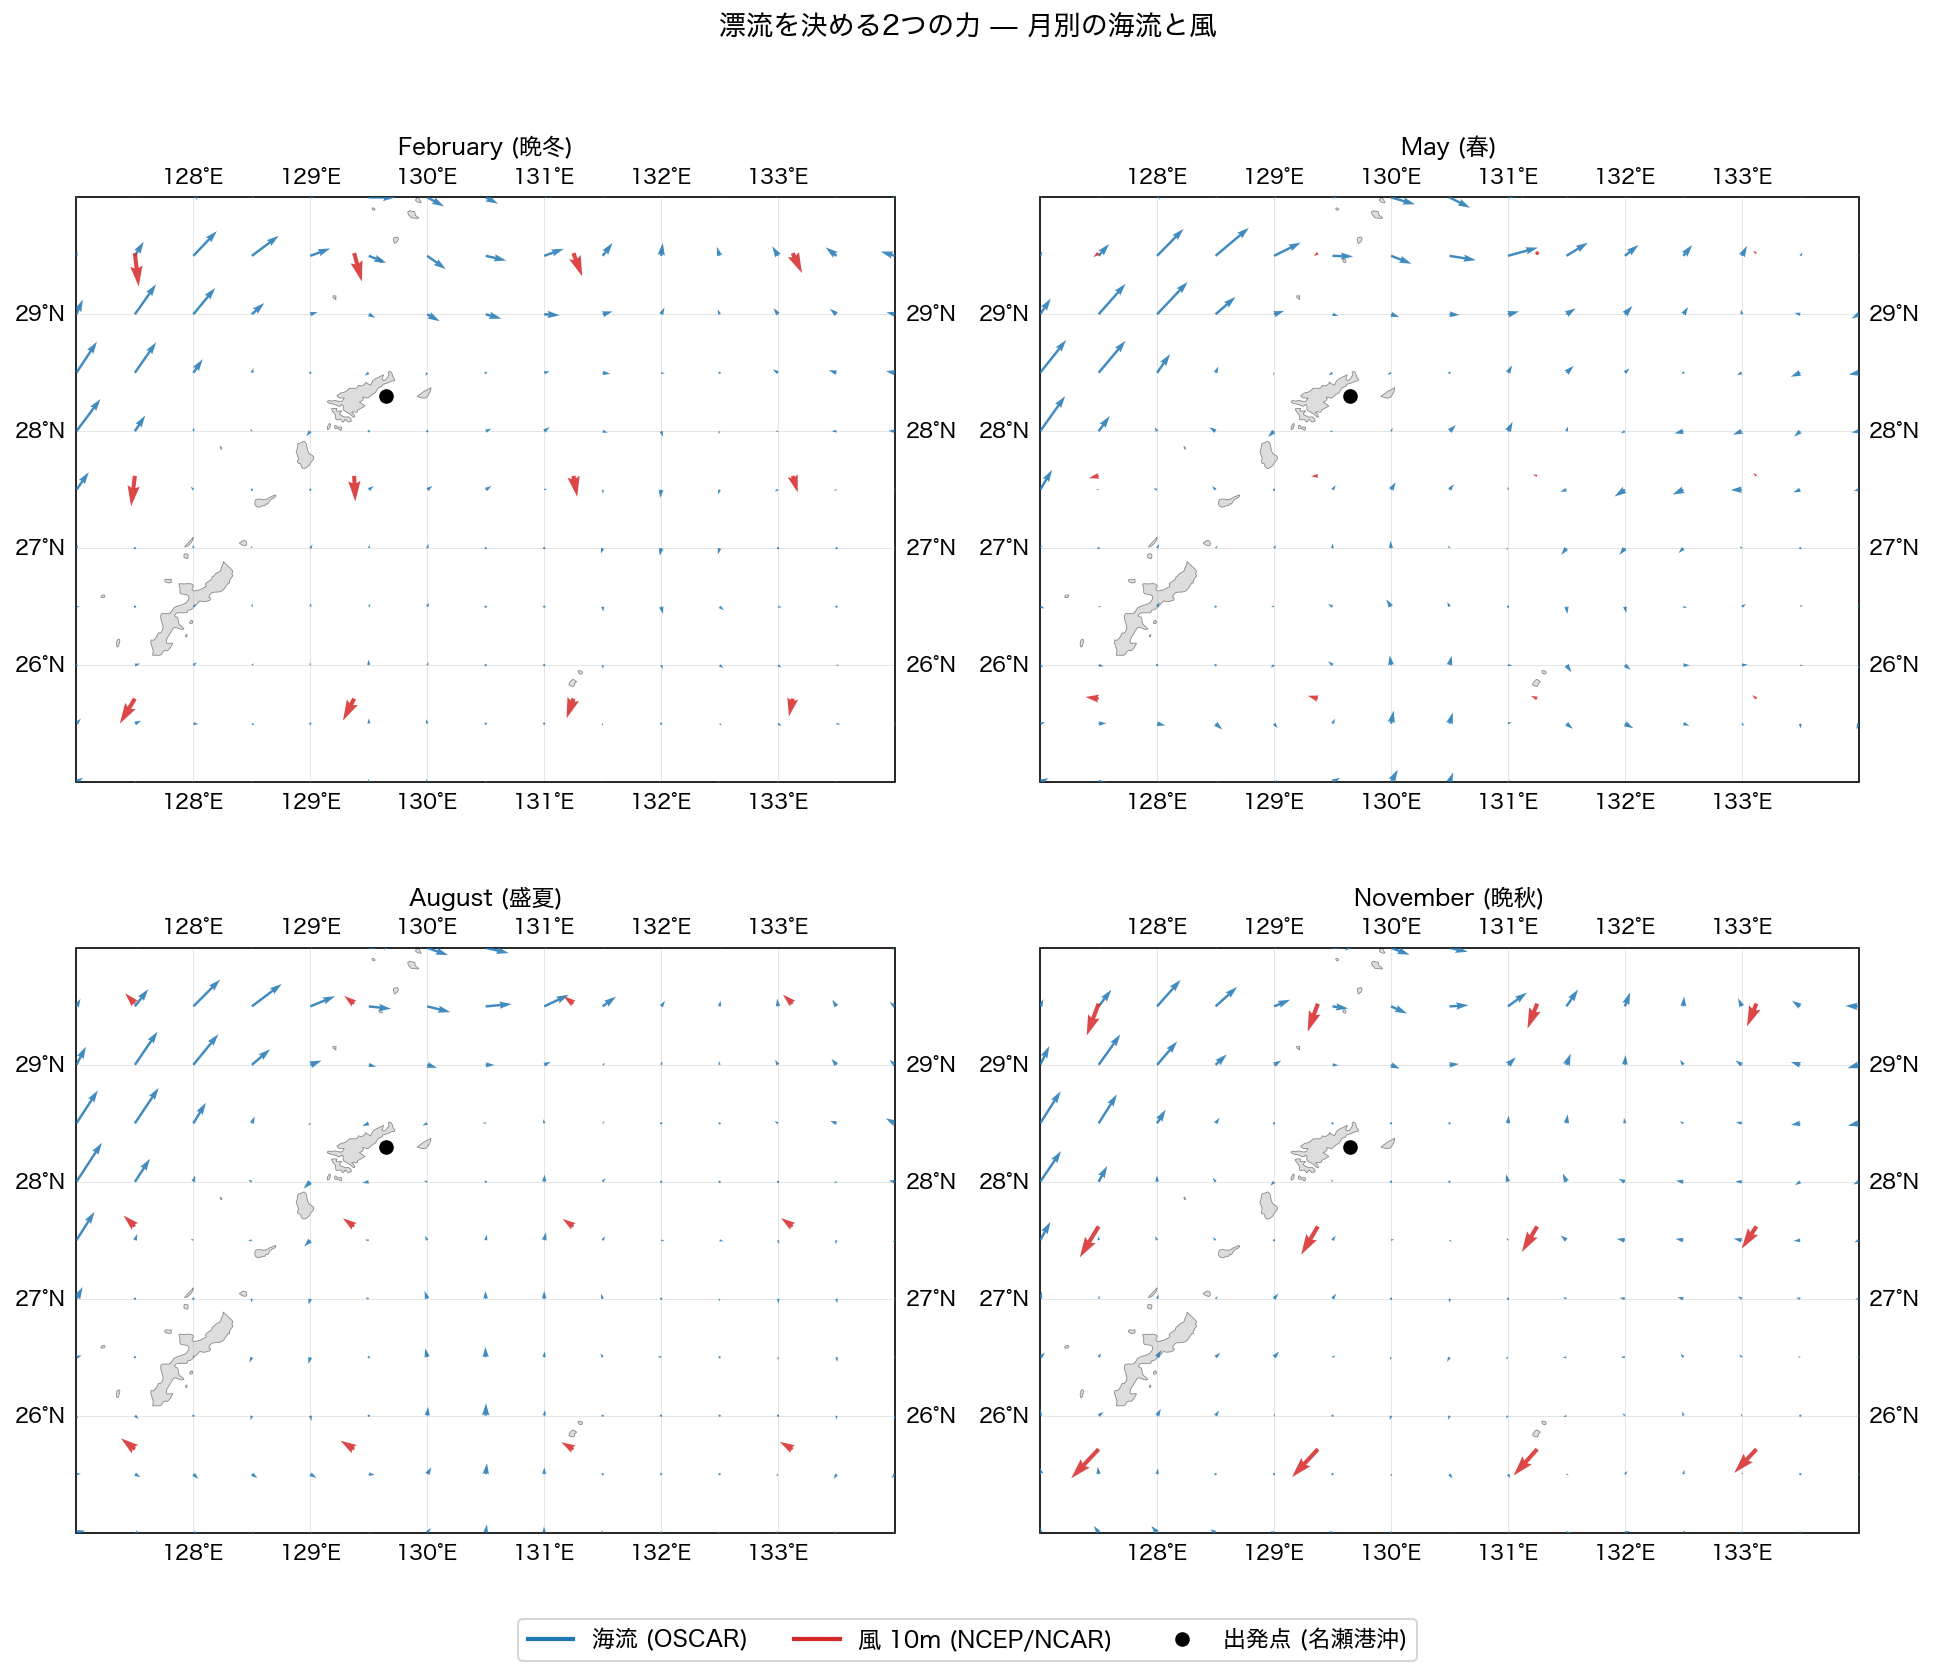
Blue arrows represent ocean currents (OSCAR); red arrows represent 10-meter surface winds (NCEP/NCAR). Current direction remains broadly consistent throughout the year (the Kuroshio flowing to the northeast), but wind direction reverses completely with the seasons.
Monthly wind speed and direction at the simulation starting point offshore Naze Port:
| Month | Wind speed | From direction | Pushes toward |
|---|---|---|---|
| February | 4.1 m/s | North | South |
| May | 1.1 m/s | East | West (weak) |
| August | 2.2 m/s | Southeast | Northwest |
| November | 5.2 m/s | North-northeast | South-southwest |
In August, southeasterly winds push particles toward the northwest — toward the main island of Amami Oshima — resulting in high stranding rates. In November and February, strong northerly winds push particles southward, combining with the eastward current component to carry them far to the southeast.
In May, winds are weak and most particles circulate near Amami Oshima, with only 29 escaping to the open ocean.
Video
The drift process was captured as video (10 days compressed to approximately 20 seconds).
May (typical example of particles remaining near the island):
November (particles carried to the southeast):
The title bar in the videos and PNGs displays "2000-01-31 to 2000-02-10." This is a dummy date anchor used to feed the timeless climatology data into OpenDrift. The actual simulations represent the "typical May" and "typical November" states.
Supplement: Version Using Specific-Date Current Forecast
Before working on the climatology version, a drift simulation for a specific date in May 2026 was also run using HYCOM (Hybrid Coordinate Ocean Model) forecast data.
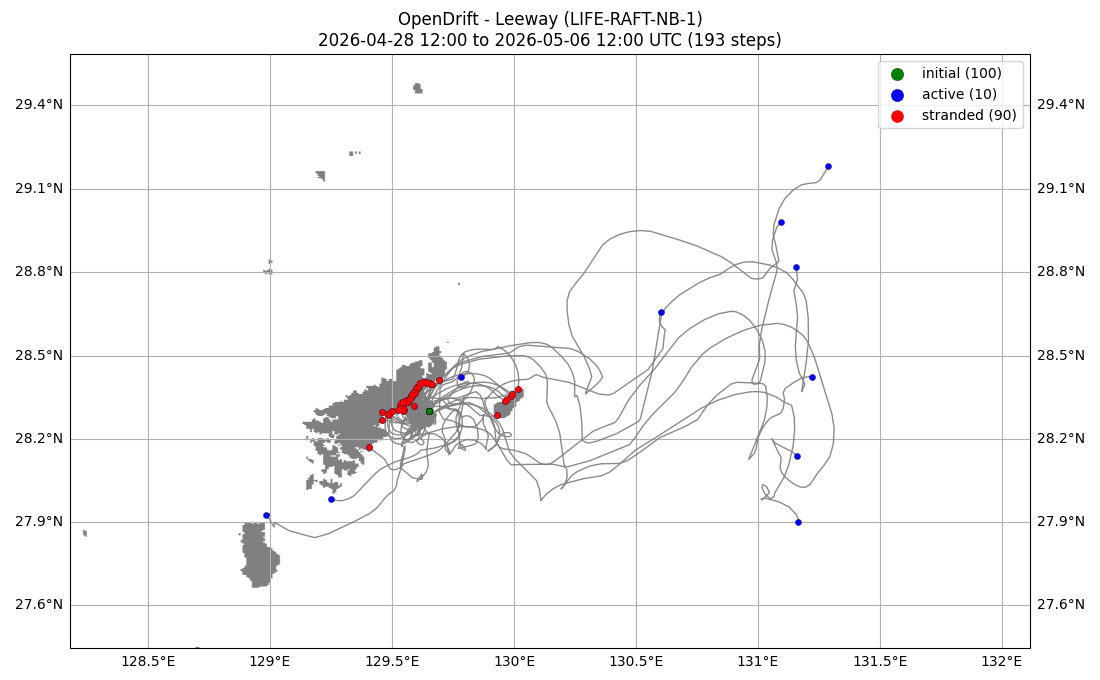
The legend uses OpenDrift's default English terms: initial (green) marks particles at the start, active (blue) marks particles still drifting in the open ocean after 10 days, and stranded (red) marks particles that have reached the island shore.
Because this version uses an actual current forecast for a specific date, results depend on the ocean conditions at that time. Behavior differs somewhat from the climatology version, but the general tendency for particles to drift east to northeast is consistent.
Caveats
This simulation models "the passive drift trajectory of a powerless floating object carried by the combined effect of ocean currents and wind." Active elements such as rowing or sailing — as would apply to an actual vessel — are not included.
Both OSCAR and NCEP/NCAR Reanalysis are climatologies constructed from observations beginning in the 1990s. This simulation should be understood as computed under modern climatological conditions.
Remaining Work
- Replace wind data with ERA5 (0.25° resolution, requires registration) to improve accuracy
- Integrate Japan Coast Guard tidal prediction data as an OpenDrift reader
- Sensitivity analysis varying the object type (switching the Leeway
object_typeparameter)
Tools and Data Used
- Python 3.12 (managed with uv)
- opendrift, xarray, numpy, matplotlib, cartopy
- Data retrieval: APDRC (University of Hawaii) and NOAA PSL via OPeNDAP (no login required for either)

Comments
…